Indian Space Research Organization (ISRO) is the pride of our nation and has proved its efficacy & Strategic importance in the world. Our Country dreams it has a great level of encomplishing, Rocketing the dreams of common man. Space Technology has been converted into a bread technology for the poor through innovative milestone of ISRO over last decades. We are happy that Alva’s Education Foundation got an opportunity to work with ISRO in expanding its mission of reaching the needy and unreached. The project NAVIC has been tendered for its practical and socio-cultural feasibility through the associated work of Alva’s Education Foundation and ISRO.
The current report is an logical conclusion of the interaction & Technical dialogue undertaken with 420 fishermen communities of following Coastal areas of Karnataka
- Malpe
- Gangolli-Maravanthe
- Mangalore
This report embodies Socio-Cultural and Technical feasibility of using NAVIC and comparison of other devices for enriching the life of Common Fishermen.
We are proud to present this report with finding from 420 fishermen and 12 NAVIC device users to ISRO and thankful for its faith in us in considering Alva’s Education Foundation as a worth organisation to associate with. We expect to continue this association of working together and to reach masses.
Expanding NAVIC need and Motivation
This unique community academia research interaction was initiated by two enthusiast leaders Shri. A. S. Kiran Kumar, Former Chairman and Dr. P G Diwakar, Director, EPDO
Shri. A. S. Kiran Kumar, Former Chairman Dr. P G Diwakar, Director, EPDO
The project has a unique objective of deploying the innovative technique of navigation and fishing tool of ISRO. The objectives of this interactions are :
- To understand Socio-Cultural conditions of the area chosen
- To investigate and report the utility & comprehension regarding various government facilities extended for fishermen and fishing as a industry
- To record technical possibilities & limitations of NAVIC tool designed by ISRO
- To present a combined report for further modifications & community centered actions.
About Indian Space Research Organization (ISRO)
The Indian Space Research Organization (ISRO) is the space agency of the Government of India headquartered at Bengaluru. The main vision of ISRO is to “harness space technology for national development while pursuing space science research and planetary exploration.”
ISRO was formed in 1969, by the efforts of independent India’s first Prime Minister, Jawaharlal Nehru, and scientist Vikram Sarabhai, managed by the Department of Space, which reports to the Prime Minister of The Republic of India. On 22 October 2008, ISRO sent one Lunar orbiter, Chandrayaan-1, and on 24 September 2014 one Mars orbiter, Mars Orbiter Mission, which successfully entered Mars Orbit, making India the first nation to succeed on its first attempt, , and ISRO the fourth space agency in the world as well as the first space agency in Asia to successfully set a record with a launch of 20 satellites in a single payload, one being a satellites from Google. On 15 February 2017, ISRO launched 104 satellites in a single rocket (PSLV-C37) and created a world record. ISRO launched its heaviest rocket. Geosynchronous Satellite Launch Vehicle-Mark III (GSLV-Mk III). On 5 June 2017 and placed a communication satellite GSAT-19 in orbit, With this launch, ISRO became capable of launching 4 ton heavy satellites.
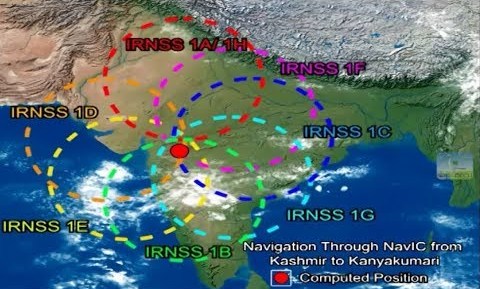
About NAVIC – India’s Indigenous Positioning System
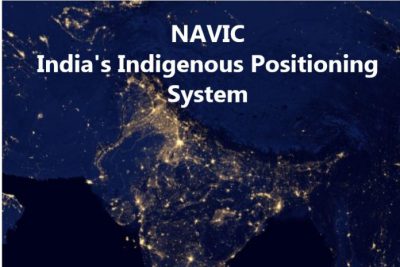
NAVIC: NAVigation with Indian Constellation is India’s very own GPS system. NAVIC was named by Indian Prime Minister Narender Modi. With These Satellites India has waltzed into the elite club of countries that have their own navigation systems with the launch of the 7th Satellite of the GPS system, NAVIC is now ready for deployment. With NAVIC, ISRO has not only brought to us another thing to be proud about but will be making it easier to have more accurate navigation facilities. Until now only 4 countries had this technology namely USA, EU, RUSSIA, CHINA respectively. India’s GPS system consists of a total of seven satellites.
Navic will guide fisherman and sailors by showing the shortest route to regions where there is a big concentration of fishes. It will also help them to stay away from foreign waters. It will aid armed forces in accurately determining their positions in combat and direct missiles direct into enemy territory. NAVIC’s position accuracy will aid relief and rescue operations conducted during disaster situations like floods and earthquakes. It will reduce India’s dependence on foreign navigation systems such as GPS. NAVIC, when used along with GPS, can ensure minimum technical snags and increasing efficiency. The constellation is already in orbit and system is expected to be operational from early 2018. NAVIC will provide two levels of service, the ‘standard positioning service’ will be open for civilian use, and a restricted service for authorized users.
The system is claimed to have an accuracy of better than 20 meters. To avail the benefits of NAVIK in our smart phones people will not have to buy a new phone, perhaps some apps will be enough to take care of the functional aspects. It may take some time. Currently, most mobile phones, navigation devices and Telemetric systems are based on ‘GPS’ and many of the mobile phones also support GLONASS. Once the system is made operational, device makers and OEM’s (Original equipment manufacturer), can incorporate support for NAVIC into their devices. ISRO has already developed a chipset that can be incorporated into devices. But it needs to be manufactured. ISRO is in talks with telecom operators and Smartphone manufacturers to make use of IRNSS system in their devices.
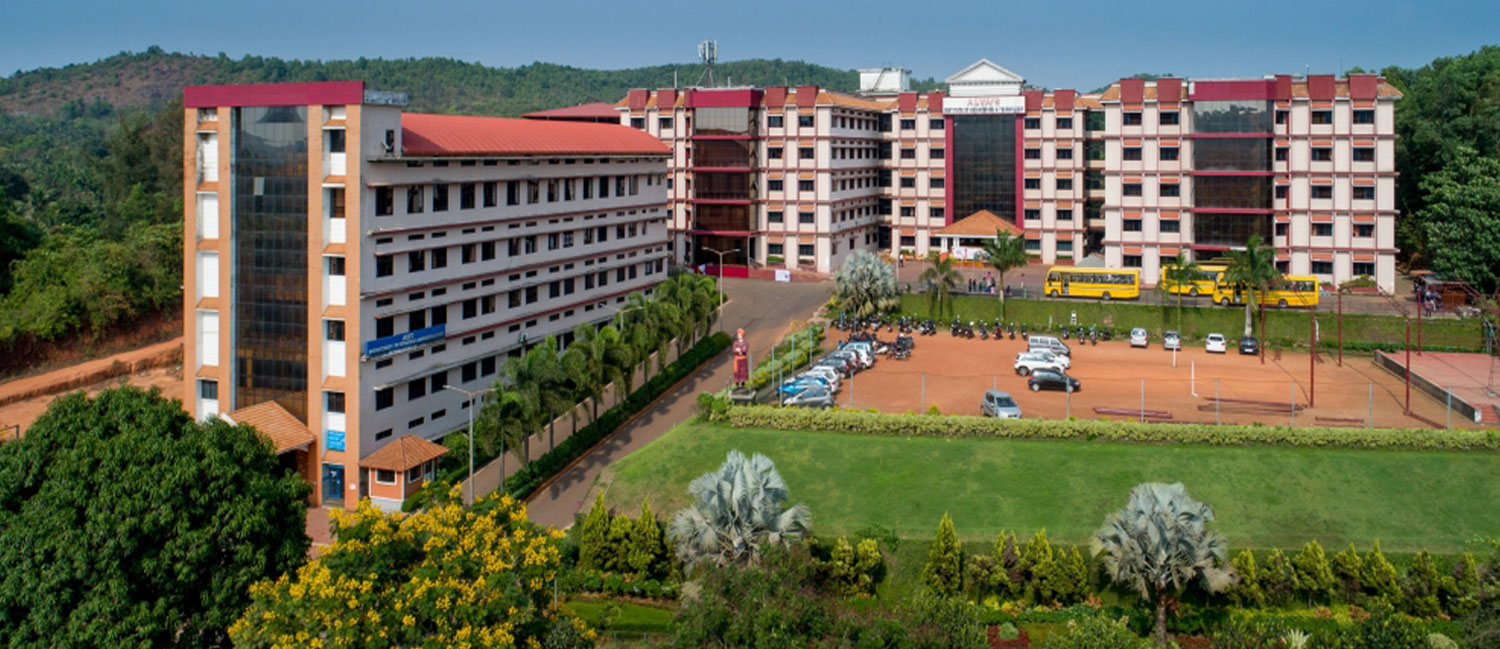
About Alva’s Education Foundation
Alva’s Education Foundation (R) , the dream child of Dr. M Mohan Alva, a visionary genius with an ability to spot talent youth potential and amazing fund for resourceful ideas for reinventing and restructuring social , Cultural and ethnographic milieu of society is founded to cater the budding talented youth of the society.
Alva’s Education Foundation (AEF) located in Moodbidri (Dakshina Kannada District) has 19 institutions under its fold offering kinder garden to graduate and post graduate courses in engineering, medicine, commerce, pure sciences, Para-medical and humanities. AEF has more than 27000 students pursuing their education in various courses out of almost 5000 students are under full scholarship for Academics, Sports, Cultural, Tribal, North East, Economically backward students provided by foundation.
AEF was established with the primary objective of serving the rural youth of the region by providing wholesome education, which apart from focusing on pure academics, also provides opportunities for students to develop their other innate abilities by organizing literary and cultural events/programs. The students are encouraged to participate in these programs at the competition and organizing level. By sensitizing the students to the traditions and culture, AEF is making sincere efforts to preserve the Kannada cultural heritage with its traditions.
Alva’s Institute of Engineering & Technology (AIET), a unit of AEF was established in 2008 at Mijar, Moodbidri and is affiliated to VTU, Belgum. AIET has bachelor programs (BE) in Civil, Computer Sciences, Electronics & Communication, Information Sciences and Mechanical Engineering. So far 5 batches of BE students have graduated from this institute and are working in various organizations across the globe.
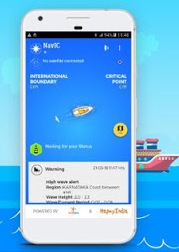
About Navigation with Indian Constellation Kit And App
It is an autonomous regional satellite navigation system that provides accurate real-time positioning and timing services.
- NAVIC – kit and App is a new invention in traffic system developed by ISRO based on the galaxy.
- NAVIC is the special kind of system which functions better than the rest of the GPS system and cheaper compared to other GPS.
- NAVIC – kit and App is specially designed for the fishermen to assist them in their Job. This App provides the accurate information on their location, distance travelled, potential extremes.
Socio – Technical prospectus of Fishing & Fishermen with special reference to fishing hubs of Coastal Karnataka
Introduction
Fisheries sector plays a crucial role in the National economy. This sector is mainly contributing towards poverty alleviation, supply of animal protein and foreign exchange earnings. Fishing is one of the oldest occupations perhaps it is older than agriculture when man took to settlement on land and its exploitation for production of crops. Relatively, fishing requires a little input of time and equipment. Being a traditional and also an important occupation, the people involved in this sector, face lot of challenges.
Analysis and Interpretation of the data
The collected data has been analysed and interpreted in the following manner.
NAVIC Device – A Socio- technical feasibility and expectation report
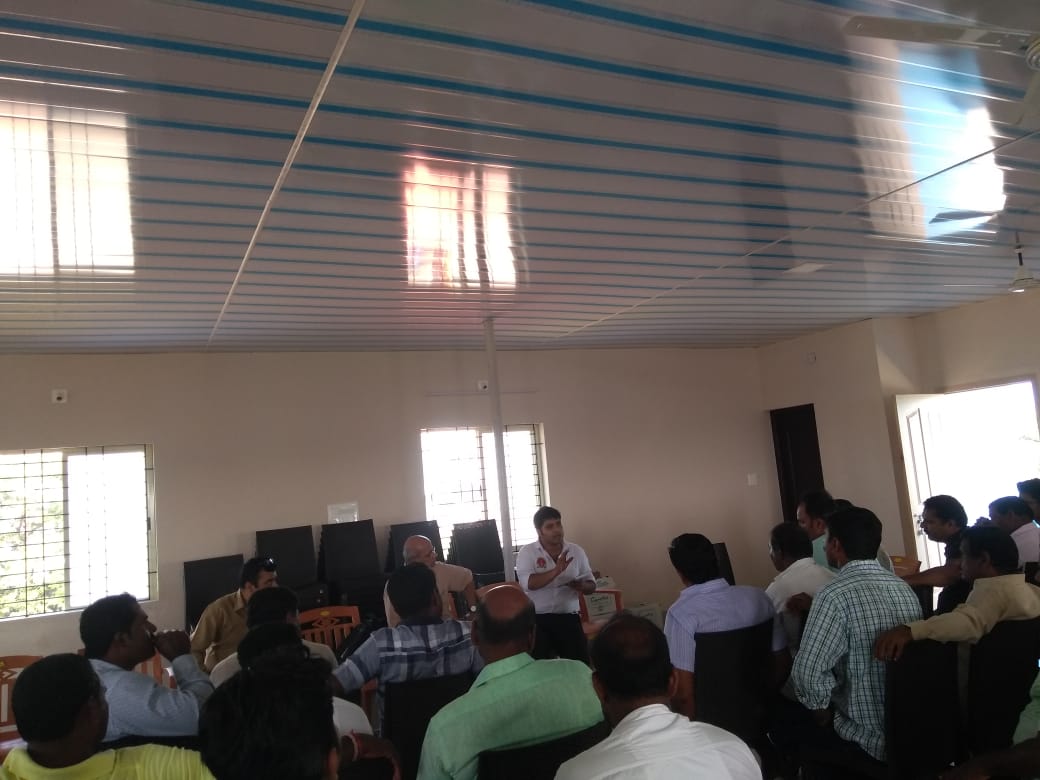
ISRO has undertaken several measures to educate the fishermen about the working and usage of the NAVIC kit and App. The first demonstration was held at Gangolli Persian Boat Unions Board room on 24th September 2018 at 11 A.M. In this demonstration fishermen and boat owners of Gangolli – Maravanthe regions are requested to participate large in number.
Dr. Divakar P.G. Director,EPDO, will address the fishermen regarding the NAVIC kit and App. Sri. Vivek Alva, Managing Trustee of Alva’s Education Trust, Dr. Peter Fernandes, Principal, AIET and AIET faculties were the part of this program.
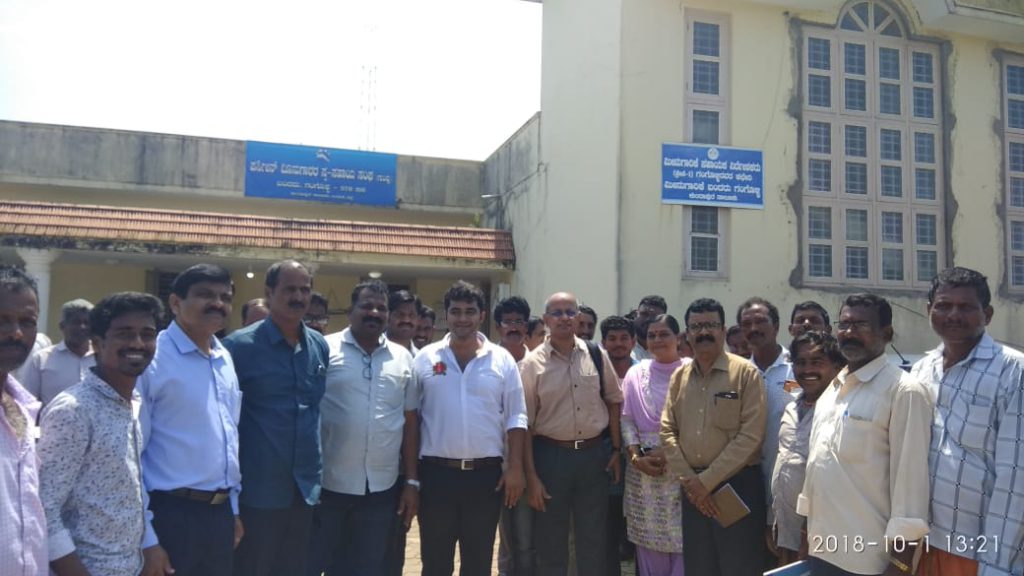
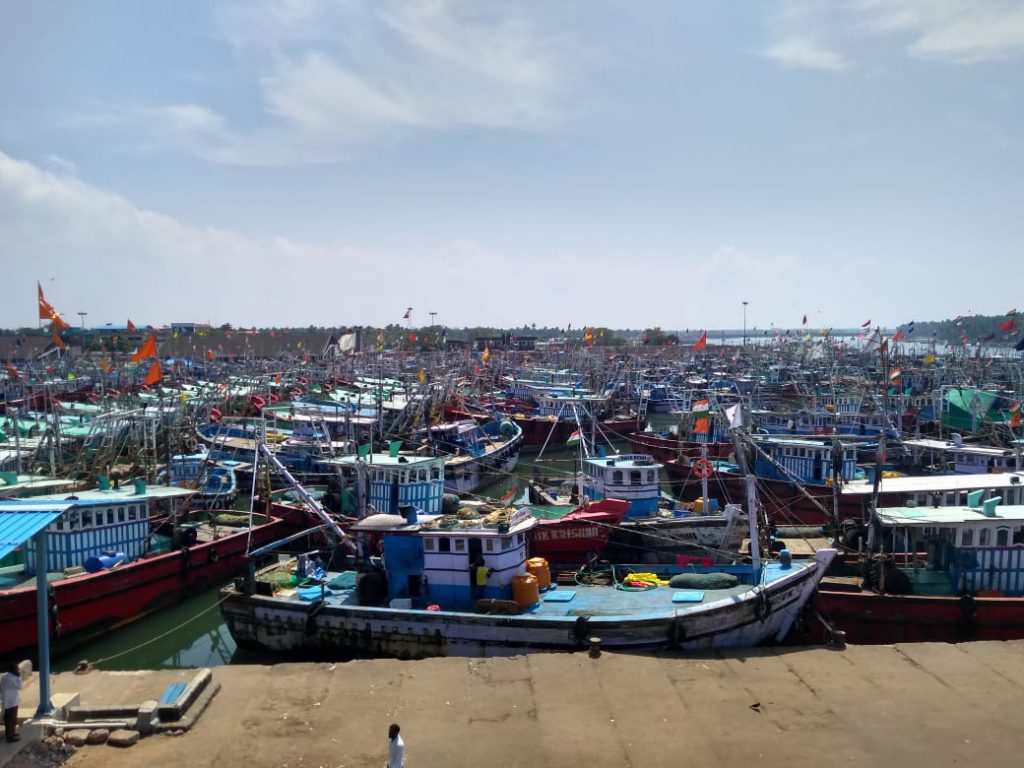
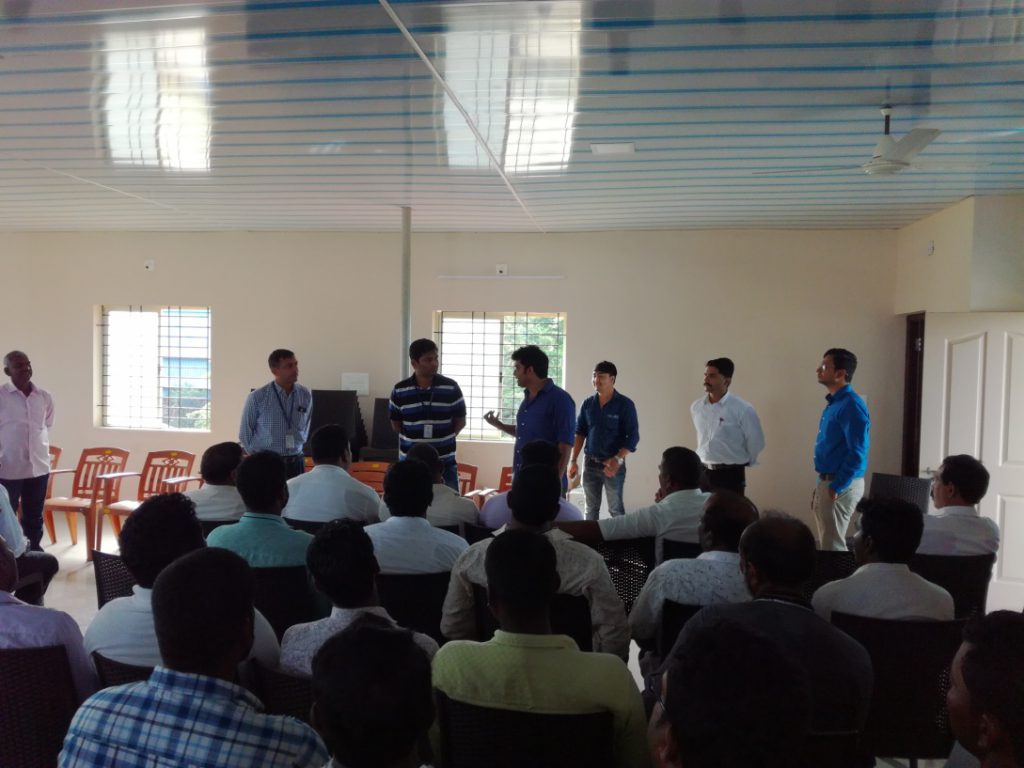
The navigation with constellation survey meeting was held on 1st October 2018 at Persian harbour, Malpe and Gangolli with the presence of Mr. Vivek Alva, Managing Trustee, Alva’s Education Foundation, Moodbidri, Dr. P.G Diwakar, Director,EPDO, Dr. Peter Fernandes, Principal, AIET, Mr. Naveen, Mr. Krishna Suvarna, Mr. Santhosh , the Secretaries , Persian Boat , Malpe, and more than 100 fishermen were present for the meeting along with the Professors and Students of Alva’s Institute of Engineering and Technology Mijar.
In the meeting various problems were discussed with the local fishermen from Malpe and data was collected from them and the president of NAVIC project Dr. P.G. Diwakar, Director,EPDO gave a brief explanation about the project and what are the benefits the fishermen are going to get from this project.
Dr. P.G. Diwakar, Director,EPDO, Sri Vivek Alva, Managing Trustee, AEF, Moodbidri, Dr. Peter Fernandes, Principal, AIET in Gangolli
The main motive of this project is to come with new navigational instrument for boats at lesser cost by ISRO. The current equipment which is used by the most of the fishermen was Furano GPS for navigation and Icom for wireless communication to the port. Those equipment’s which were used they were mainly Japanese and Taiwan made those were very expensive to buy for the local fishermen. The present cost of the entire kit is Rs. 1,05,000 and ISRO is promised to give at the lesser cost. The main demand from the fishermen was they should be able to find out the varieties of fishes and there should be an alarm to be fixed to the boat for the alert for the other fishermen.
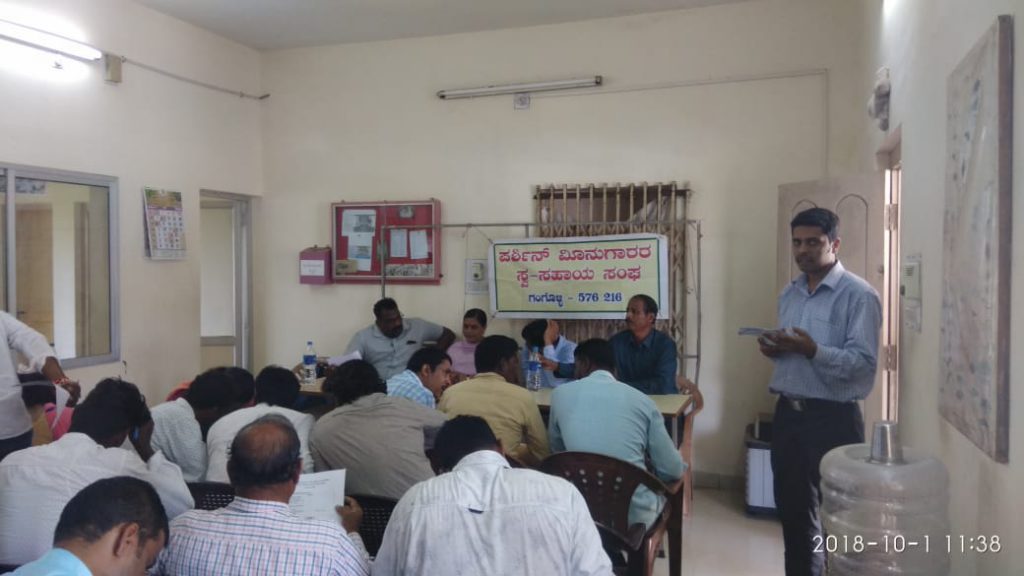
After the meeting the students of AIET went for the field survey and collected data from fishermen’s and Boat Owners.
Survey by the Students of AIET in Persian Boat at Malpe
Discussion with fishermen by Dr. P.G. Diwakar, Director,EPDO and Sri Vivek Alva, Managing Trustee, AEF, Moodbidri in Malpe
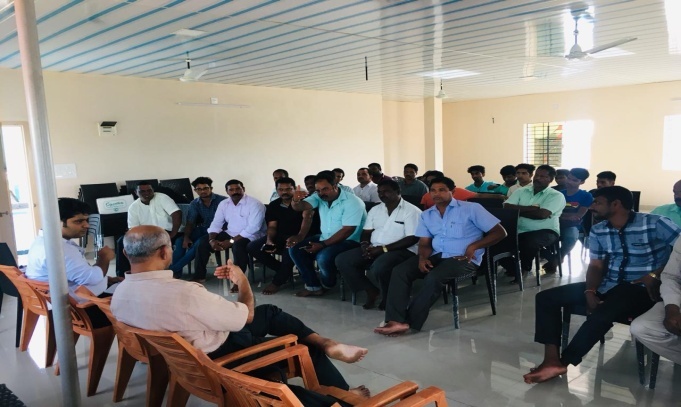
The navigation with constellation survey meeting was held on 4th October 2018 at Panjurli Temple, Malpe with the presence of Prof. Kurian,Principal, Alva’s Degree College, Moodbidri, Sri. Shivkumar Asst Director, Fisheries Department, Government of Karnataka, Mr. Yashodhara Ameen, President, Persian Boat Union, Malpe Mr. Naveen, Mr. Krishna Suvarna, Mr. Santhosh , the Secretaries , Persian Boat Union , Malpe, and more than 400 fishermen were present for the meeting along with the Professors of Alva’s Institute of Engineering and Technology Mijar.
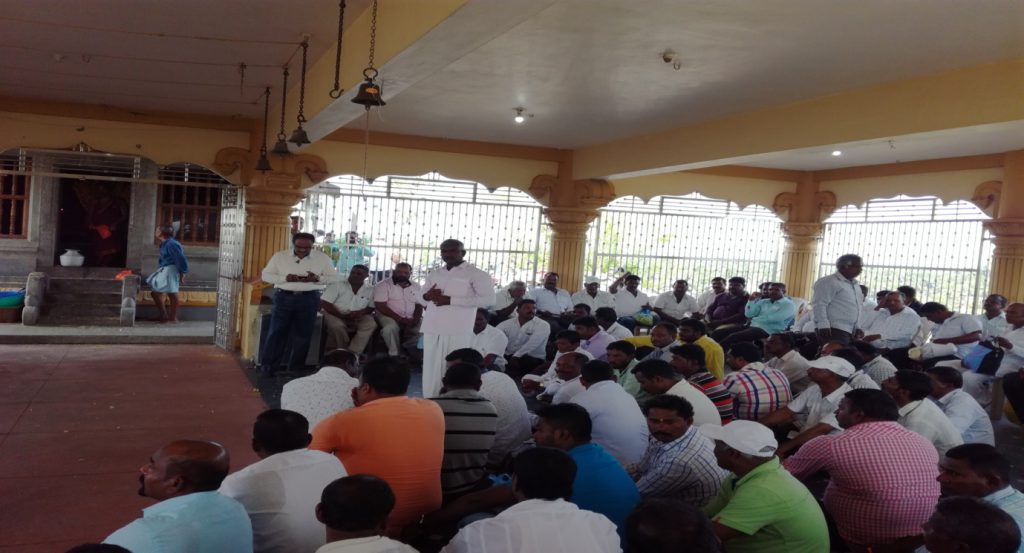
Discussion with fishermen by Prof. Kurian, Principal, Alva’s Degree College, Moodbidri
In the meeting various problems were discussed with the local fishermen from Malpe and data was collected from them and Prof. Kurian gave a brief explanation about the project and what are the benefits the fishermen are going to get from this project . Sri. Shivkumar Asst Director, Fisheries Department, Government of Karnataka, suggested to add Transponder (Automatic Identification system) features to the Navic Kit as it is mandatory from the Government.
After the meeting the Professors of AIET went for the field survey and collected data from fishermen’s and Boat Owners.
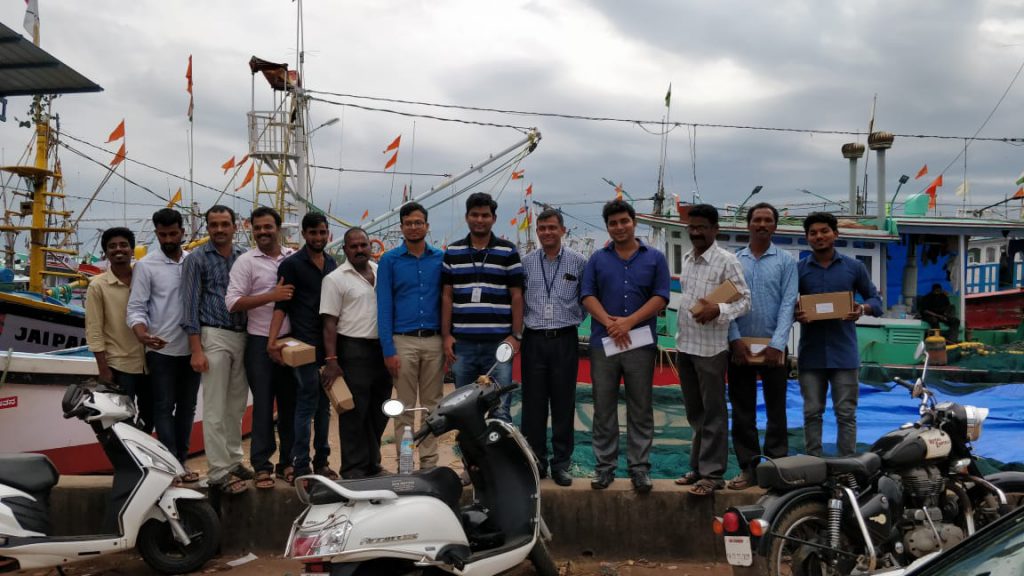
The NAVIC – Demonstration and kit distribution was held on 4th October 2018 at Persian harbour, Malpe with the presence of Mr. Vivek Alva, Managing Trustee, Alva’s Education Foundation, Moodbidri, Mr.Akhileshwar, Senior Scientist, ISRO, Bangalore, Mr. M Saxena, Senior Scientists, ISRO, Bangalore, Mr. Bhargav, Senior Engineer, Antrix Software Bangalore, Mr. Naveen, Mr. Krishna Suvarna, Mr. Santhosh , the Secretaries , Persian Boat , Malpe, and more than 150 fishermen from both malpe and gangolli harbour were present for the demonstration along with the Professors of Alva’s Institute of Engineering and Technology Mijar.
Navik Kit Demonstration and Distribution with fishermen by Sri Vivek Alva, Managing Trustee, AEF, Moodbidri and scientists, ISRO, Bangalore in Malpe
Mr.Akhileshwar, Senior Scientist, ISRO, Bangalore, Mr. M Saxena, Senior Scientists, ISRO, Bangalore and Mr. Bhargav, Senior Engineer, Antrix Software Bangalore, have demonstrated and explained the usage of the Navic Kit. The Navic kit was distributed to selected 12 fishermen from both Malpe and Gangolli region.
Mr. Vivek Alva addressed the gathering and requested to make use of the kit and to give correct feedback on the same. And also suggested the secretary of Union, Mr. Krishna Suvarna, to handover the kit to other 12 fishermen after 15 days of usage.
We are contented in presenting the conclusions arrived from this study for academic & technical up gradation among all the stakeholder involved in the study. The need and expectation of fishermen community with respective policies support, technical support and program support is presented here for consideration.
The livelihood strategies of Fishermen will create opportunities for more income as well as increase the resource base of coastal areas. The present study was mainly undertaken to study the occupational challenges of Fishermen community in coastal regions of Udupi and Dakshina Kannada Districts of Karnataka. Though most of them are from Fishing families, the advancement in technology has made them pose wide variety of problems. Instruments or devices used in fishing are not easily accessible to all the categories of fishermen. The support system by the Government is also very weak. The increasing cost of devices and lack of awareness about recent apps for fishing has created new challenges for fishing community in the coastal areas. The Government must take keen interest in resolving the problems of these Fishermen so that it can contribute towards the sustainability of Fishing occupation.
CONTRIBUTORS FOR THE STUDY
- P G Diwakar, Director, EPDO, ISRO
- Vivek Alva, Managing Trustee, Alva’s Education Foundation, Moodbidri
- Peter Fernandes, Principal, Alva’s Institute of Engineering and Technology, Mijar
- Kurian, Principal, Alva’s College, Moodbidri
- Ramesh Kunder, President, Persian Boat Union, Gangolli
- Krishna Suvarna, Secretary, Persian Boat Union, Malpe
- Santhosh, Joint Secretary, Persian Boat Union, Malpe
- Naveen, Joint Secretary, Persian Boat Union, Malpe
- Dattathreya Gujjar, Dean Planning, Alva’s Institute of Engineering and Technology
- Manjunath Kotari, Professor and Head, Dept. of CSE, AIET
- Jayanth Rathod, Head, Dept. of ISE, AIET
- Harish Kunder, Dept. of CSE, AIET
- Darmananda M, Dept. of MBA, AIET
- Sapna, Dept. of BSW, Alva’s College, Moodbidri
- Prasad G T, Civil Engineer and PWD Contractor, Gangolli
- Hemanth Kumar N P, Dept. of CSE, AIET
- Vivek Sharma, Dept. of CSE, AIET
- Deepakraj, Dept. of ECE, AIET
- Yuvaraj, Dept. of ECE, AIET