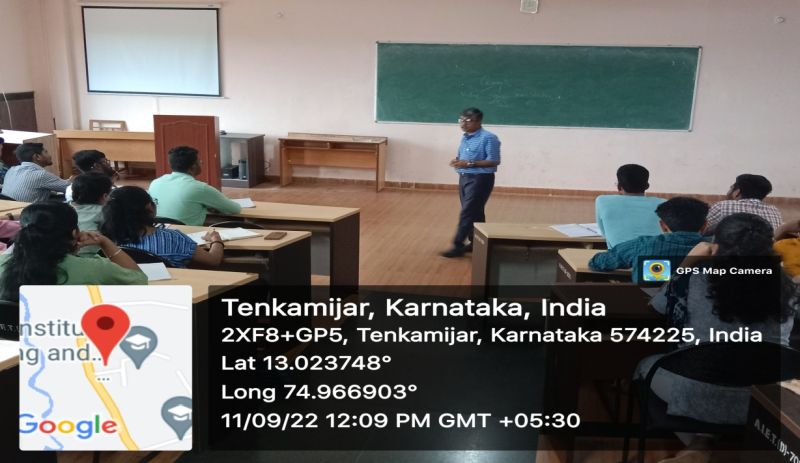
1. Training Programme: Introduction to US tax laws and practice
Resource Person: Mr Johnson Fernandes Asst. Professor and Mrs Maithri, Sr. Lecturer – MBA Dept.
Duration : 120 hours
The Second Year MBA students with Finance specialization are undergoing training in US Tax Laws and Practice for 80 hours. The course covers general taxation, Individual tax, Partnership Tax and Corporate Tax modules. This training course is designed by Ernst and Young. It is imparted by Mr Johnson Fernandes and Mrs Maithri faculty trained by EY in Bangalore. Students who excel in this training will have employment opportunities with EY and other leading Tax Consulting firms.
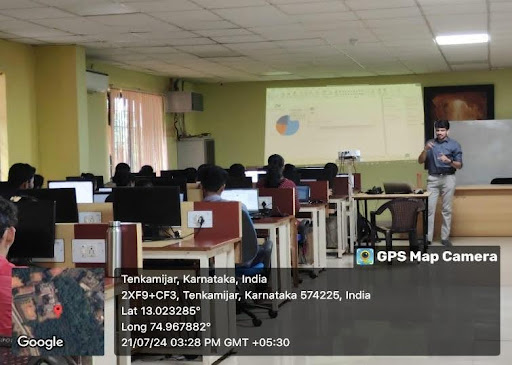
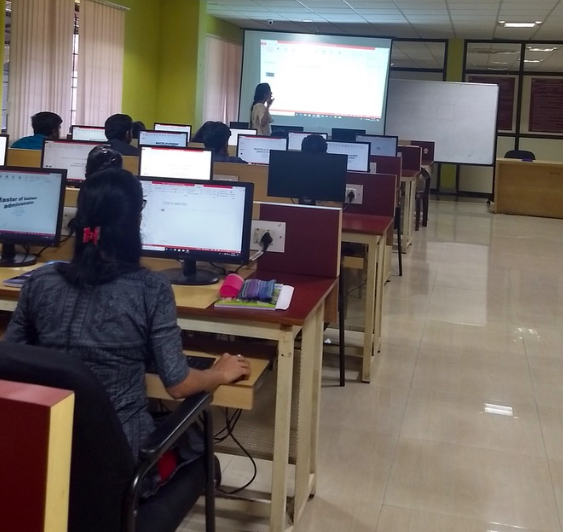
2. Training programme : Computer Applications for Business
Trainer: Mr Ganesh Rao, M/s. Empowering People Knowledge
Training programme: HR – Payroll Administration & Accounts , GST Administration
Duration : 80 hours

The MBA students were provided with Practical Training of Payroll & Accounting with GST to possess employability skills which are much desired by the prospective employers. The practical aspects of Payroll, Provident Fund Form filling, Online PF submissions, ESI, Income tax calculations, Tax calculation reports, Payslip Calculations, Form 16, etc. were taught. In addition, the MBA students were trained in Tally, Cost Centre Creations & Reports, Accounts with Inventory which includes Stock Items, Stock Groups, Godowns & Unit of Measurements, GST Calculations, Online GST Filing, GST in Tally ERP 9, b2b entries, b2cl, b2c entries, Credit & Debit Notes with GST in tally with HSN & SAC Codes.

3. Training programme: Microsoft Word; Microsoft Excel, MS Power point and HTML
Trainers: Ms Megha, Ms Reena, Ms Ankitha, Ms Vidya, Ms Mangala and Ms Shruthi Shetty, Faculty of Department of Computer Science Engineering, AIET
Duration: 52 hours

The first year MBA students were taught computer applications for business by the Computer Science faculty. The following syllabus was covered during the semester:
- Microsoft Word: Introduction, Manipulating Text, Formatting Characters, Formatting Paragraphs, Themes and Templates, Preparing Documents for Printing, Organizing Content, Tabs, Columns, and Charts, Links, Headers, and Footers.
- Microsoft Excel: Introduction, Tables, Cell referencing, Advanced data formatting, Charts & graphs, Text formulas, Logical Formulas, Adding, Deleting and Hiding Worksheets, Grouping Worksheets, Data Validation, Drop-Down Lists, Removing Duplicates, Multiple Sheet References, Consolidating Data – With or Without Links.
- PowerPoint : Basics, Modify presentation themes, Add and edit text to slides. Add new slides to a presentation, insert clipart images and shapes to slides, Insert and modify tables and charts, add sound and video to a slide presentation, Insert and edit animations and slide transitions, Display a speaker-lead and self-running presentation
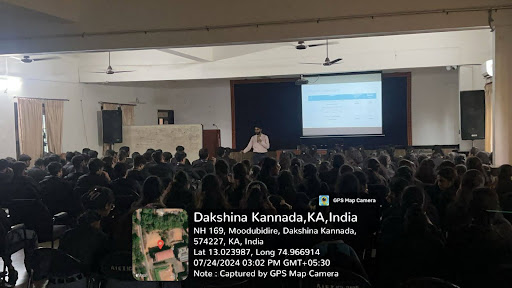
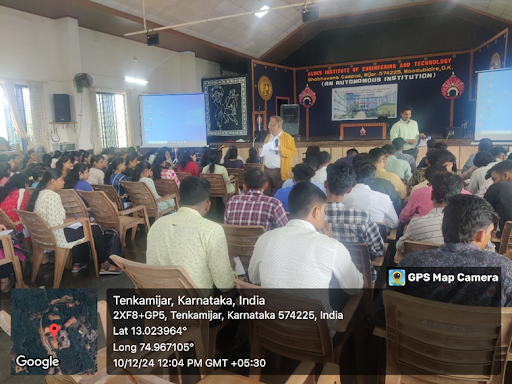
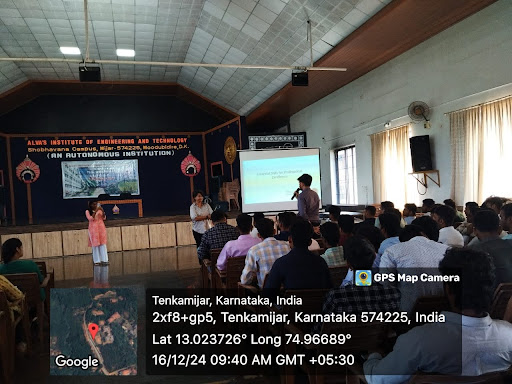
4. REPORT ON ICT TRAINING – 2025
DATE: 23.06.2025 TO 04.07.2025
Resource Person: Mr Rahul Agarwal, Trainer, GT Bangalore
Program Objectives
- To equip Students with the practical skills required for efficient data handling and business reporting using Microsoft Excel.
- To build foundational understanding of Excel structures, functions, and tools used for cleaning, analysing, and visualizing data.
- To promote best practices in data quality management and introduce automation through Power Query.
- To empower participants to create professional dashboards that support data-driven decision-making.
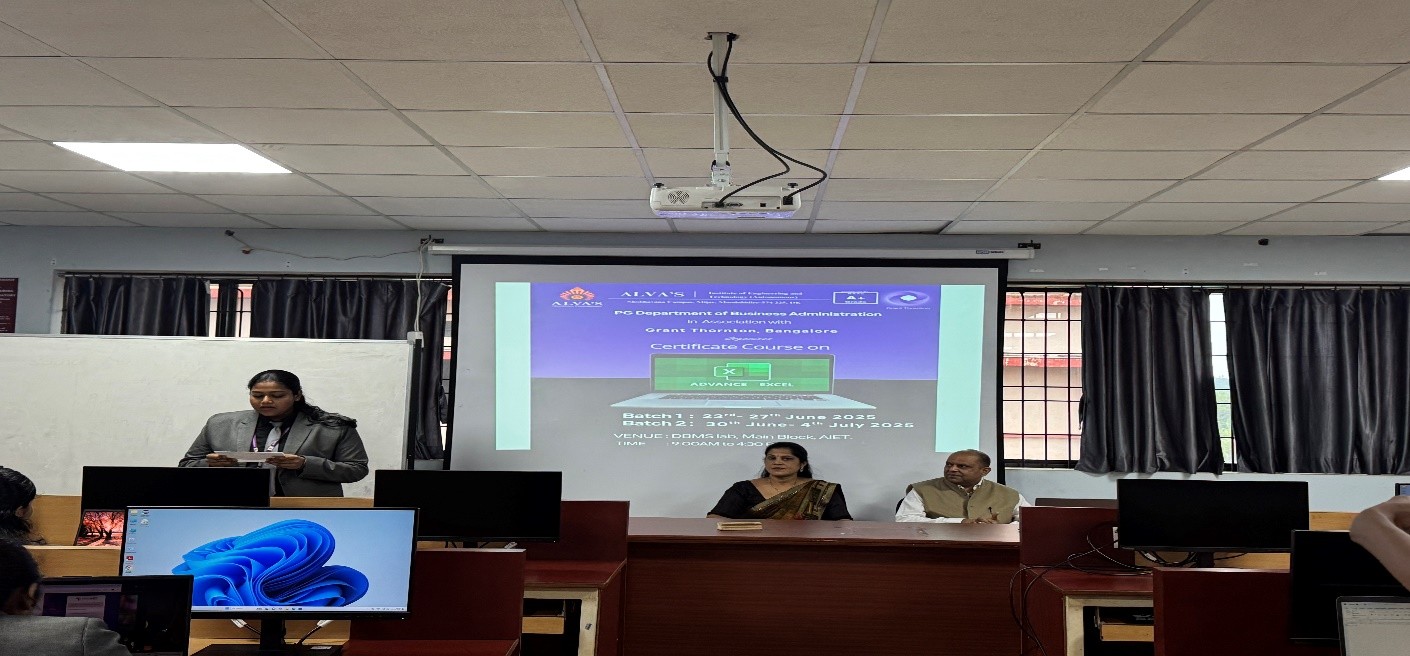
PG Department of Business Administration Organised Certification Program on Advanced Excel in Association with
Grant Thornton Bharat LLP, Bangalore for the students of first year MBA in two different batches.
Batch 1 – commenced from June 23rd 2025 to June 27th 2025 and batch 2 from
June 30th to 4th July 2025 respectively.

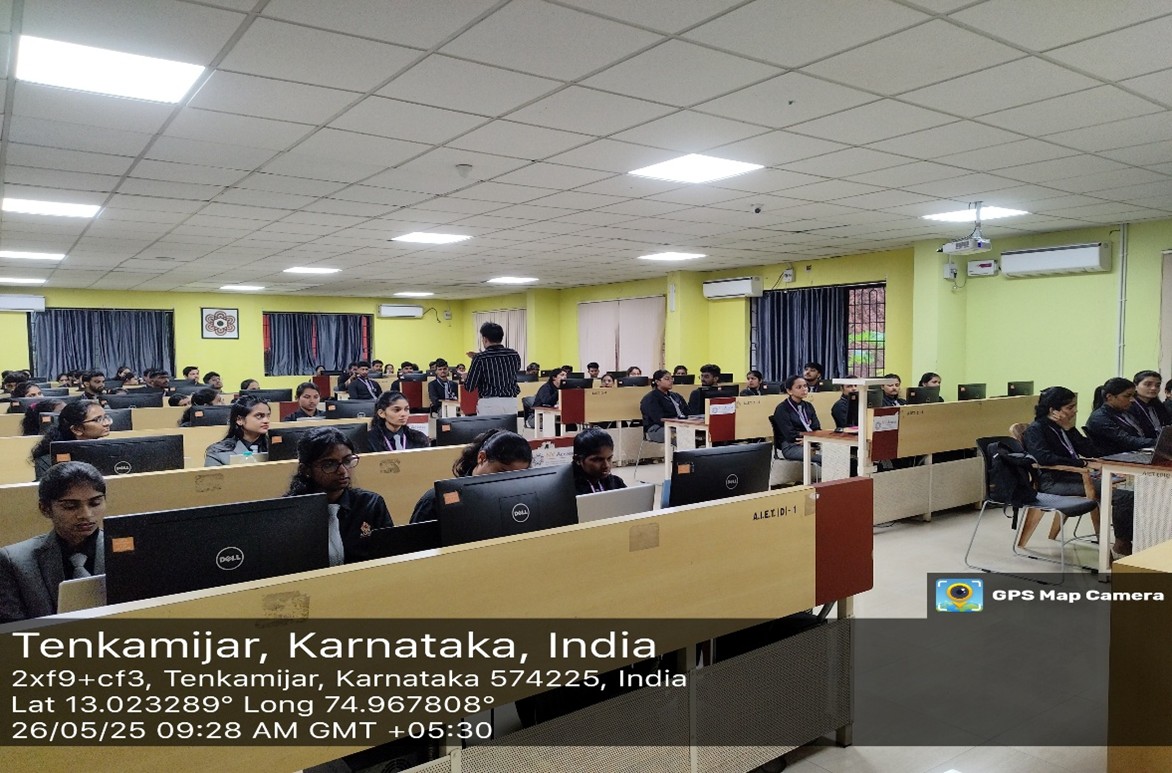
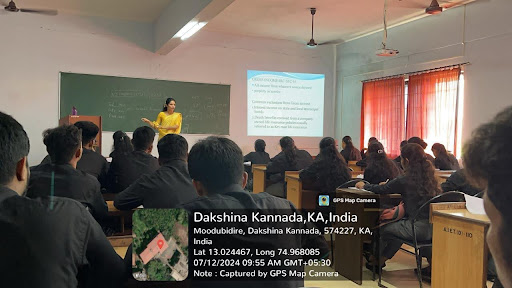
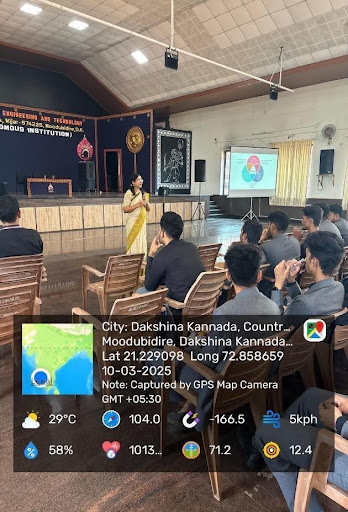
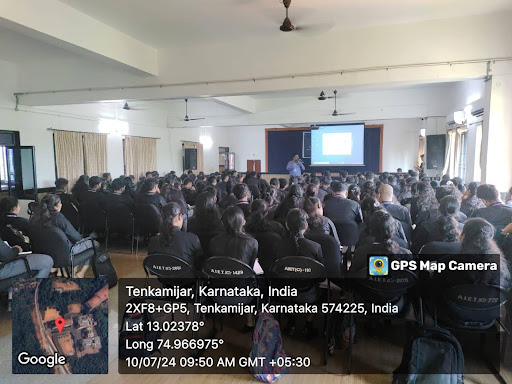
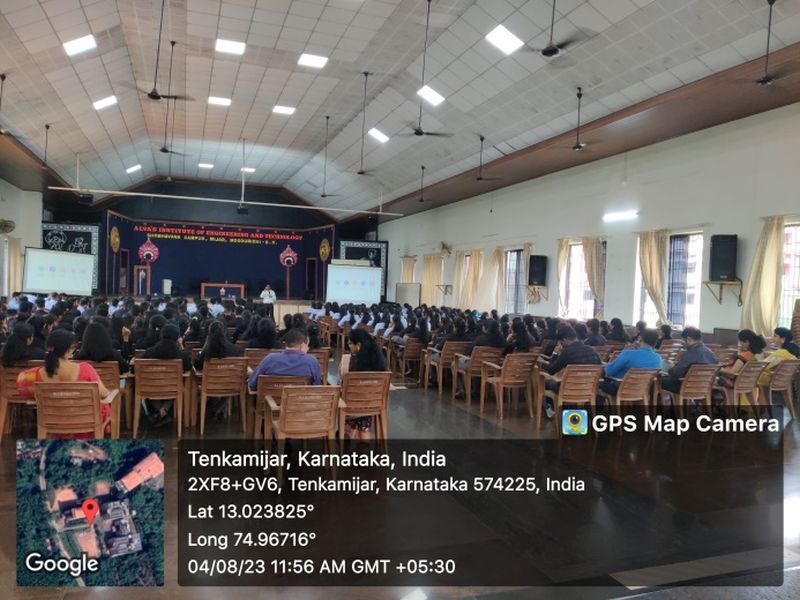
Inauguration of ICT TrainingThe five-day Microsoft Excel Training Program was designed to build foundational and intermediate-level proficiency in Excel,
with a focus on real-world data analysis, data cleaning, and reporting. The primary objectives were to equip participants with
the essential skills to manage, clean, analyze, and visualize data effectively using Excel, and to introduce automation tools
like Power Query for scalable and reliable data processing. The program aimed to promote data-driven decision-making through
hands-on exercises, structured learning modules, and collaborative projects.
Day 1: The training began with a welcome and orientation session, followed by an introduction to the Excel interface, navigation tips, and file types. Students explored the structure of Excel workbooks and learned about data types such as text, numbers, dates, and logical values. Emphasis was placed on data quality, with discussions on common issues like missing values, duplicates, blank cells, and formatting inconsistencies. A practical activity titled “Find the Flaws” challenged participants to identify errors in a flawed dataset, reinforcing the importance of clean data.
Day 2: Focused on cleaning and preparing data for analysis. Students learned to use text-based functions such as LEFT(), RIGHT(), TRIM(), and TEXTJOIN() to clean and structure textual data like names and addresses. Flash Fill and Text-to-Columns were demonstrated for quick formatting tasks. Logical functions like IF(), IFERROR(), and ISBLANK() were used to flag invalid entries and manage blanks. The session also covered date handling, fixing inconsistent formats, and managing common formula errors to enhance dataset reliability.

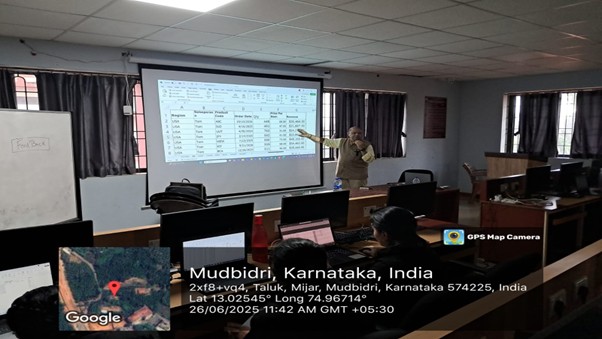
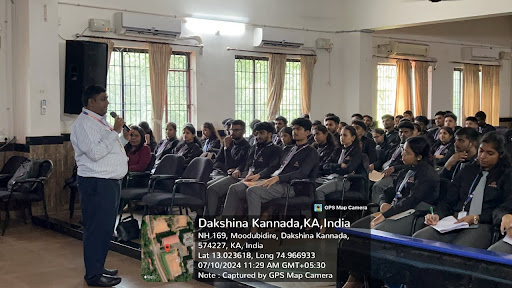
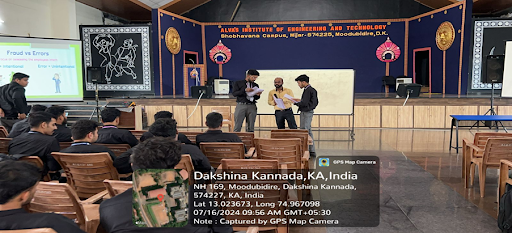
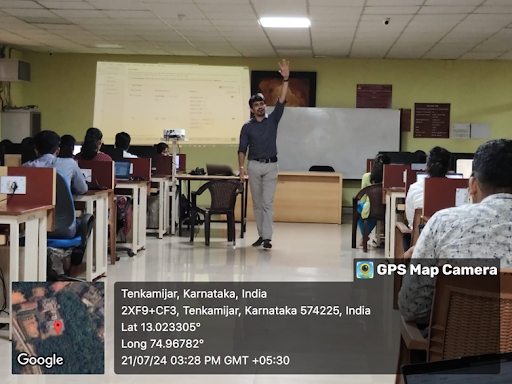
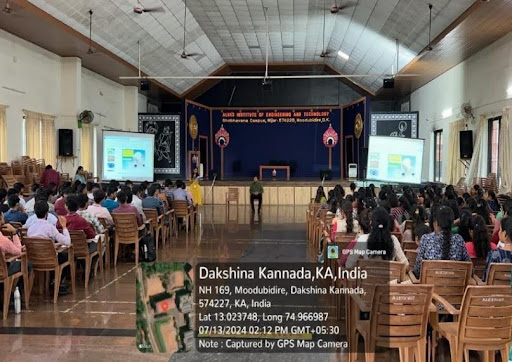
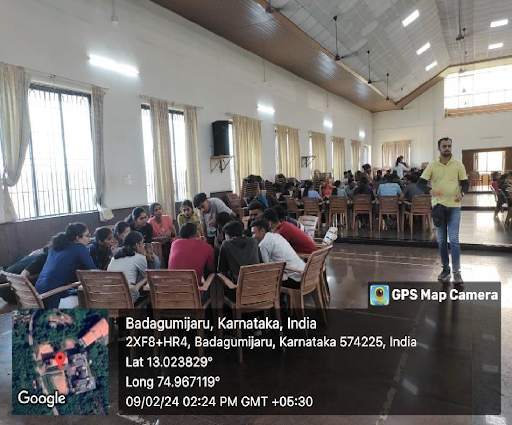
Excel Training by Mr Rahul AgarwalDay 3: The focus shifted to lookup functions and combining datasets. Students learned how to use VLOOKUP(), HLOOKUP(), and XLOOKUP() to extract information from related tables. They then progressed to the INDEX and MATCH combination for more flexible data retrieval. Microsoft 365’s dynamic array functions such as FILTER(), SORT(), and UNIQUE() were introduced for modern spreadsheet users. A real-world activity required participants to merge two datasets (e.g., employee master and performance data), resolve mismatches, and produce a cleaned and integrated report.
Day 4: Centered around PivotTables and dashboard design. Students explored how to use PivotTables to aggregate data and derive insights. They customized Pivot layouts, added calculated fields, and inserted interactive elements such as Slicers and Timelines. The session included hands-on work with Pivot Charts and focused on building clear, action-oriented dashboards. The capstone activity involved creating a region-wise sales dashboard, which was presented for peer review, demonstrating participants’ ability to build dynamic, interactive reports.
Day 5: Introduced Power Query and its Extract-Transform-Load (ETL) framework for automating data preparation. Students navigated the Power Query Editor, applied steps for data transformation, and practiced joining data using Merge and Append queries. They imported data from multiple sources—including Excel, CSV, and web datasets—and performed transformations such as renaming columns, changing data types, and pivoting/unpivoting data. The final mini-project involved preparing and visualizing a multi-source dataset using Power Query and PivotTables, showcasing the end-to-end process from data import to dashboard delivery.

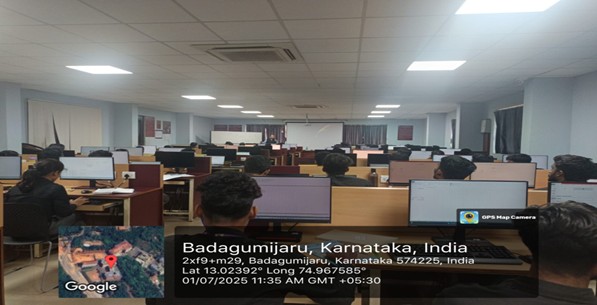
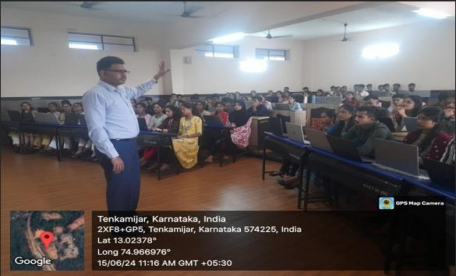
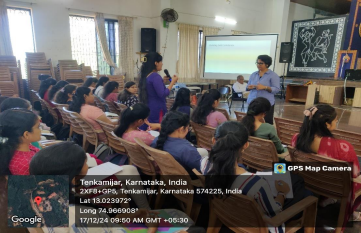
Students working on Excel
Program Outcomes:
Strong Foundation in Excel Essentials: Students developed confidence in navigating Excel’s interface, formatting data consistently, and identifying common data quality issues.
Proficiency in Data Cleaning Techniques: Students gained hands-on experience using text, logical, and date functions to clean and prepare raw data for analysis, improving data reliability and structure.
Ability to Combine and Analyze Complex Datasets: Students mastered lookup functions (VLOOKUP, XLOOKUP, INDEX & MATCH) and dynamic arrays to merge and analyze datasets effectively.
Dashboard Design and Data Visualization Skills: Students built interactive dashboards using PivotTables, charts, slicers, and filters, enabling clear, actionable insights for decision-making.
The program concluded with a wrap-up session, participant reflections, and certificate distribution. Learners shared their final dashboards
and received feedback from peers and instructors. Overall, the training successfully enhanced participants’ Excel capabilities,
improved their data handling skills, and empowered them to produce insightful, automated reports suitable for modern business environments.
Total of 154 students benefitted from the session
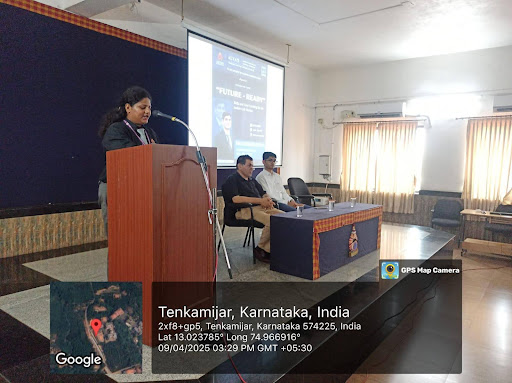
5. Report of Power BI Workshop
Date: 26th May 2025 to 28th May 2025 – Batch 1
29th May 2025 to 31st May 2025 – Batch 2
Resource Person: Mr. Sananda Rao, Founder and CEO, Data Dristi, Bengaluru
Objectives:
- Understand the fundamentals of Business Intelligence (BI) and its role in data-driven decision-making.
- Connect, import, and transform data from various sources using Power BI tools.
- Create interactive dashboards and reports to communicate insights effectively.
- Prepare for industry-standard roles such as data analyst, business intelligence analyst, and reporting specialist.
PG Department of Business Administration organized workshop on Power BI for I year MBA students.
The students were divided into two batches of 77 each.
Session 1 (Day 1): Introduction to Power BI, Data Transformation, Data Modelling, Calculated Measures & Columns
During the first session of the Power BI workshop, participants were introduced to the fundamentals of Power BI,
including its purpose and capabilities in business analytics. The session covered the end-to-end process of Power BI,
highlighting its user interface and key features that make data visualization intuitive and efficient.
An introduction to the Power Query Editor was provided, demonstrating how to clean and transform data.
Participants also learned to create calculated columns and measures to perform data analysis.
The session concluded with an overview of data modelling techniques to build robust and insightful dashboards.
Session 2 (Day 1): Data Visualization
In the second session of the Power BI workshop, participants explored various visualization techniques starting with
column and bar charts for comparative data analysis. The session introduced drill features that allow deeper insights
through hierarchical data navigation. Key topics included the use of AI capabilities within Power BI, understanding header icons,
and managing data through aggregations and summarizations. Participants also learned to format visuals for better presentation and readability.

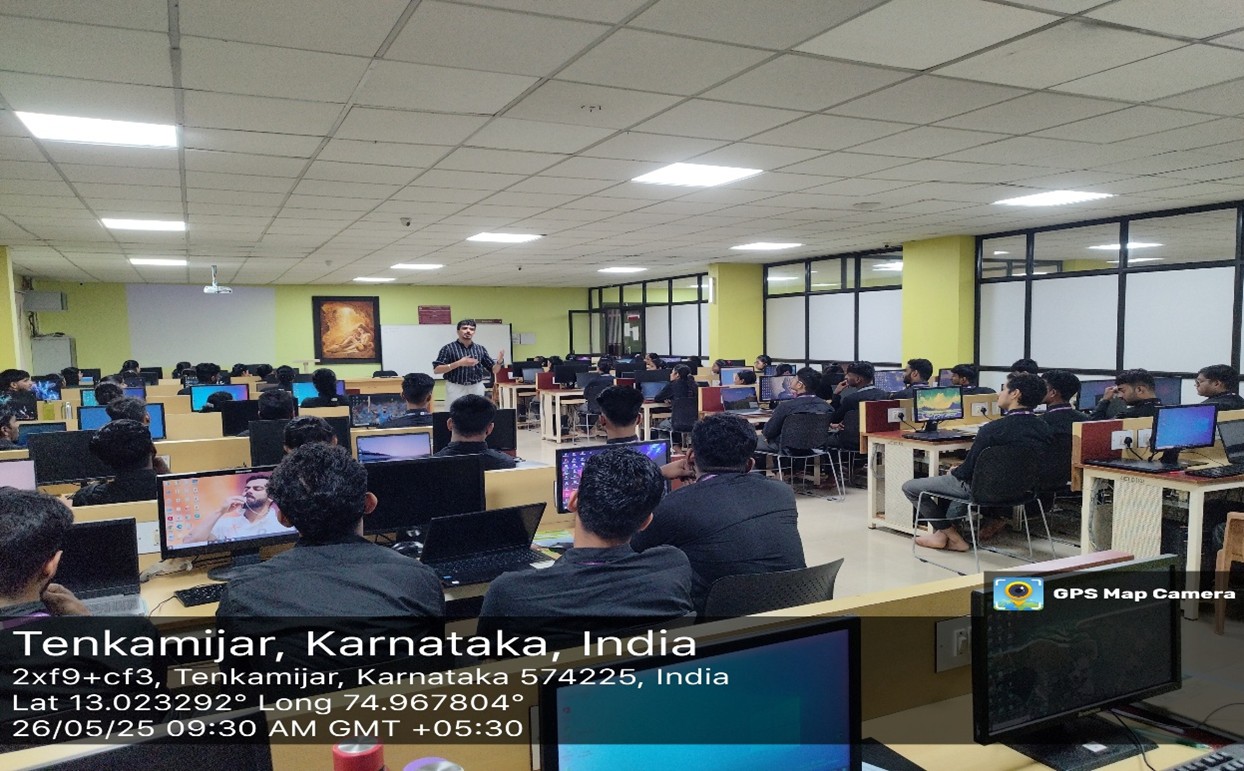
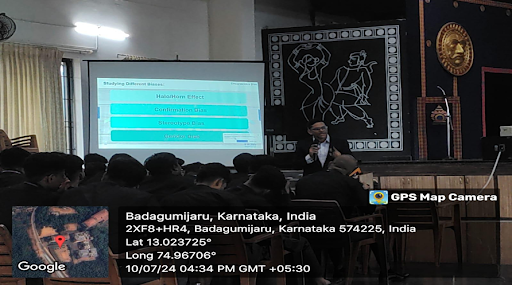
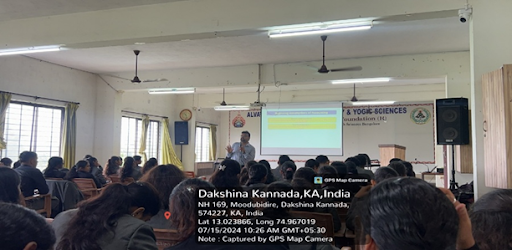
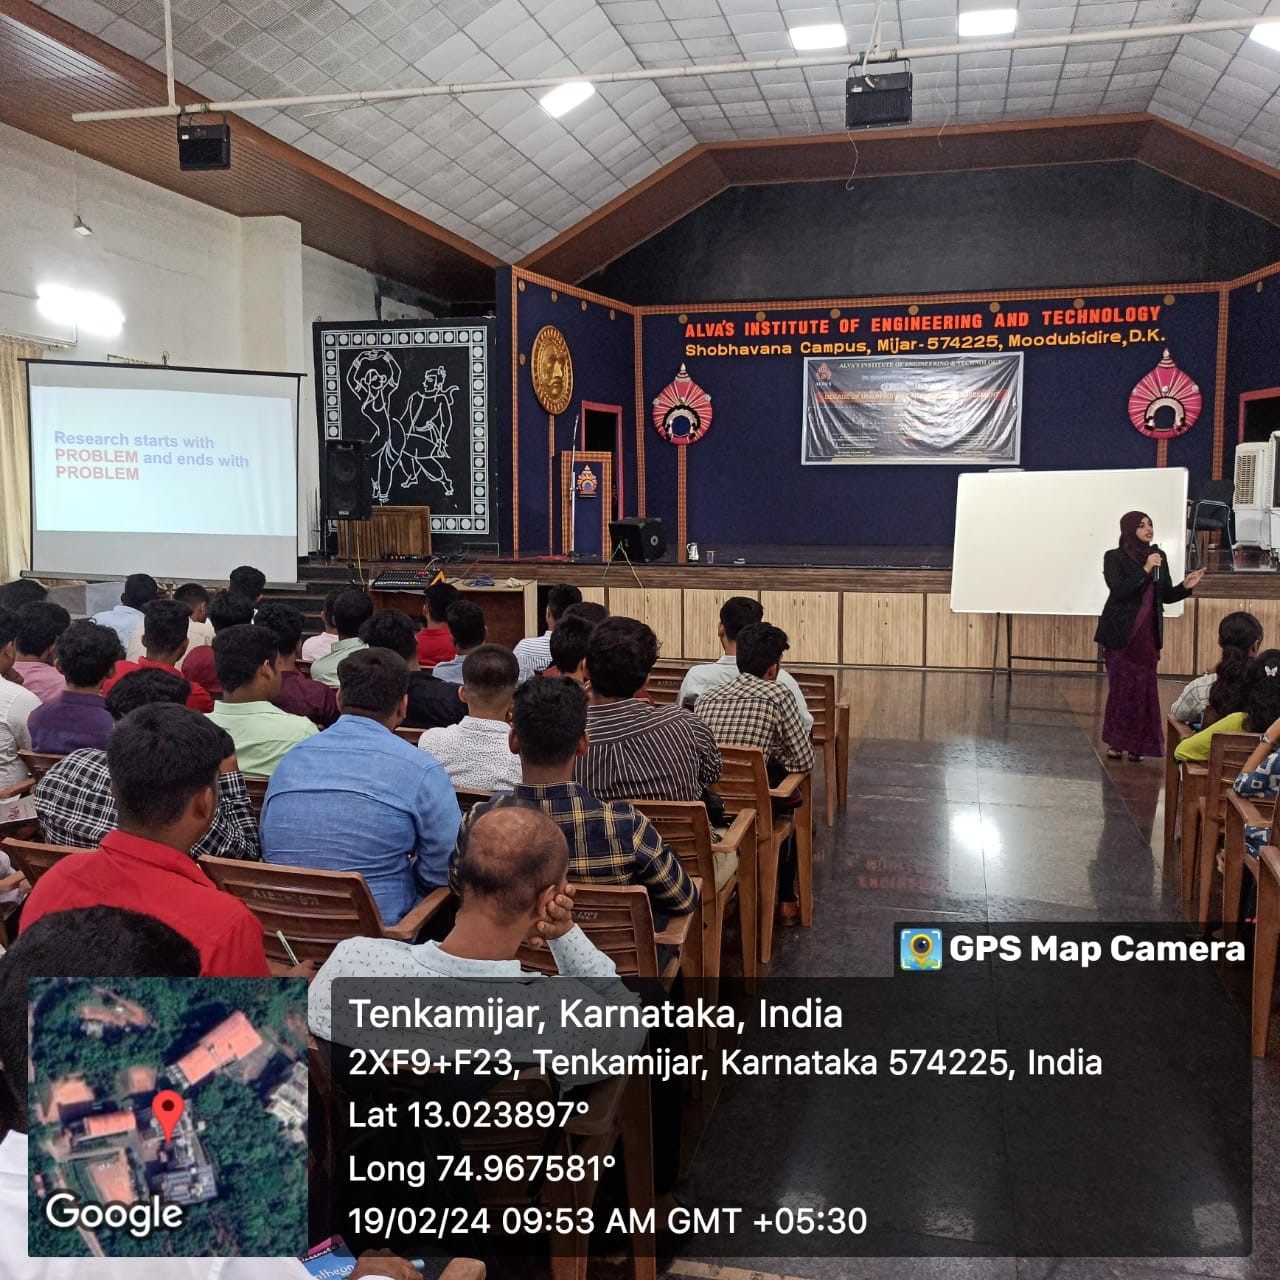
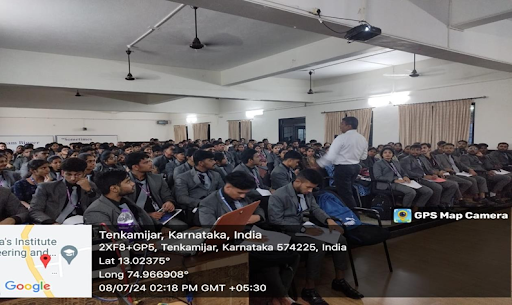
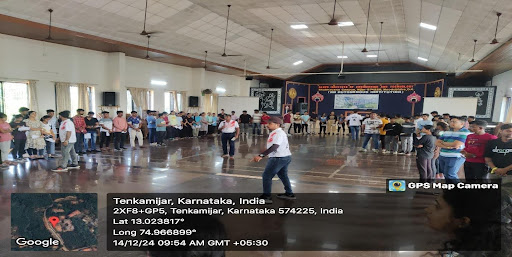
Mr. Sananda Rao training the studentsSession 3 (Day 2): Data Visualization
The third session of the Power BI workshop focused on advanced visualization techniques to enhance data storytelling.
Participants learned to create line, area, and combinational charts for trend and performance analysis.
The session also covered the use of funnel, ribbon, scatter plot, and waterfall charts to represent various business scenarios.
Additionally, map charts, filled maps, and gauge charts were introduced to visualize geographical and performance metrics effectively.
Session 4 (Day 2): Data Visualization
Participants were introduced to card visuals and KPIs to highlight key metrics briefly. The session also covered the use of slicers to add interactivity
and enhance user-driven analysis in reports. Tables and matrices were discussed for detailed, structured data representation, along with AI visuals
that provide smart insights. A comprehensive revision of all previously covered charts and advanced visuals was conducted.

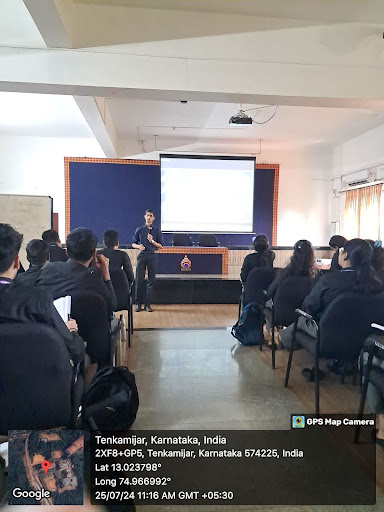
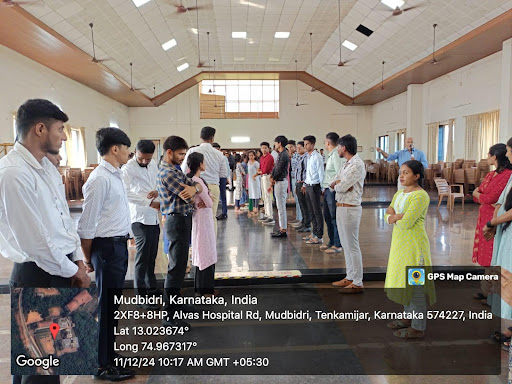
Mr. Sananda Rao Addressing studentsSession 5 (Day 3): Data Visualization, Building Reports & Dashboards
The fifth session of the Power BI workshop focused on the creation of a dynamic sales dashboard, allowing participants to integrate all their learning into a comprehensive project.
Key elements such as dashboard review, theme setup, filters, and interactive buttons were covered to enhance visual appeal and user experience.
Session 6 (Day 3): Power BI Service & Conclusion
The sixth and final session of the Power BI workshop provided an overview of the entire course, reinforcing key concepts through real-world use cases.
Participants were introduced to Power BI Service, learning how to publish, share, and collaborate on reports in a cloud-based environment.
The session highlighted various industry applications of Power BI, showcasing its versatility across sectors like finance, marketing, and operations.
Outcomes:
- Students could understand the fundamentals of Business Intelligence (BI) and its role in data-driven decision-making.
- Students were able to connect, import, and transform data from various sources using Power BI tools.
- Students were able to create interactive dashboards and reports to communicate insights effectively.
A total of 154 students benefitted from the workshop